

Thematic Analysis Service with MAXQDA

Qualitative data analysis is an important method used to gain in-depth insights in research. Especially thematic analysis with MAXQDA offers powerful tools to systematically organize and interpret data. In this article, we will discuss in detail how to perform thematic analysis using MAXQDA, coding processes and reporting techniques.
However, it is also possible to get professional support to increase the scientific quality of your research and obtain more reliable results. Thanks to our content and thematic analysis service with MAXQDA, your data is carefully examined, reports prepared in accordance with academic standards and contribution is made to the value of your studies. If you also want to receive content and thematic analysis support with MAXQDA in your thesis, article or research, you can contact us, and you can also have the opportunity to learn all the details of the method and apply it in your own studies with the step-by-step guide in the continuation of this article.
What is Thematic Analysis and Why is it Important?
Thematic analysis is a method used to identify, make sense of and interpret patterns within qualitative data. It is especially frequently applied to interviews, focus group discussions, open-ended survey responses and other textual data.
Advantages of thematic analysis:
- Helps discover meaningful themes within data.
- Responds to research questions systematically.
- Makes qualitative data more organized and interpretable.
Why is MAXQDA Preferred in Thematic Analysis?
MAXQDA is one of the most used software in qualitative data analysis with its user-friendly interface and powerful coding tools. Especially thematic analysis with MAXQDA offers advanced options for organizing, visualizing and interpreting data.
How to Perform Thematic Analysis with MAXQDA?
The first step of the analysis process is careful preparation of the data set to be used. At this stage, data in text, audio, video or PDF format is collected and organized. The integrity and quality of the data is of critical importance for the reliability of the analysis results. When the collected data is transferred to the MAXQDA software, it should be ensured that each file is correctly identified and separated into appropriate categories. This contributes to a more organized and efficient progression of the analysis process.
1. Preparation of Data Set and Transfer of Content
-
Determine the data type: Before starting the analysis, clarify what type of data you will work with. MAXQDA is compatible with text transcripts (interview, focus group, open-ended survey), images, audio recordings and video files.
-
Transfer raw data to the system: Upload texts as they are, without omitting any statement to the program. If possible, add timestamps when transferring audio and video recordings. This way you can easily access important sections during coding later.
-
Organize the data set: Organize the transferred content by separating it into categories. These categories can be based on research questions, themes, participant groups or data collection method.
-
Make an example classification: For example, you can separate interviews from different age groups into separate folders or store transcripts for different topics labeled.
-
Prepare for analysis: Consider this stage not only as a technical transfer, but also as a first look at the data and a mental framework formation process. This way, your subsequent coding and thematic analysis steps will progress much more systematically.
2. Coding Process for Thematic Analysis
Coding is the process of grouping meaningful parts in the data under specific concepts or themes. This process facilitates in-depth analysis and interpretation of data. The coding process usually takes place in three stages:
-
Open Coding: The data set is examined line by line, important expressions or concepts are determined and appropriate codes are assigned to them. At this stage, data is broken down into parts and descriptive labels are created for each part. This process helps the researcher divide the data into smaller and manageable components.
-
Axial Coding: The relationships between the codes created during open coding are examined and similar codes are brought together to create subcategories. This stage ensures a better understanding of connections and patterns between data. For example, causal relationships or conditions between different codes can be determined.
-
Selective Coding: Sub-categories determined by axial coding are collected under broader themes to create main categories. At this stage, the main findings and main themes of the research become clear. Selective coding helps the researcher create a theoretical framework based on the data.
3. Coding Techniques with MAXQDA
MAXQDA offers various tools that facilitate and speed up the coding process:
-
Automatic Coding: Allows the software to automatically assign codes for specific keywords or phrases. This feature saves time in large data sets and increases consistency. However, after automatic coding, it is important to make a manual check to evaluate the accuracy and suitability of the assigned codes.
-
Free Coding: Allows the researcher to manually code the parts they find important while reading the data. This method allows the researcher to work intuitively and flexibly. During free coding, new codes can be created or existing codes can be used.
-
Hierarchical Coding: By establishing main and sub-code relationships between codes, it enables data to be analyzed in a more organized way. This structure helps to see themes and sub-themes more clearly. Hierarchical coding is useful for better understanding relationships between data, especially in complex data sets.
4. Visualization of Themes and Interpretation of Analysis Results
MAXQDA includes data visualization tools among the best practices for thematic analysis. You can present your data effectively with code matrices, word clouds and graphs. MAXQDA offers various visualization tools so that the findings obtained in qualitative data analysis can be presented in a more understandable and effective way. Thanks to these tools, complex data sets become simpler and more interpretable.
Code Matrix Browser
Code Matrix Browser is a tool that visually represents the distribution and density of specific codes in different documents. This matrix shows codes in rows and documents in columns. The color intensity or sizes in the cells indicate how often the relevant code appears in that document. In this way, researchers can quickly identify which documents specific themes are more dominant in. For example, in an interview study, you can see through this matrix in which participants the "satisfaction" code was emphasized more.
Word Clouds
Word clouds are visuals created based on the frequency of words in the text. Frequently used words are shown larger and more prominently, while less used ones are presented in smaller sizes. This visualization is ideal for quickly identifying main themes and focal points in the text. To create word clouds in MAXQDA, you can visualize instantly by selecting the relevant texts and using the "Word Cloud" tool. This method is useful especially for identifying prominent concepts in large data sets.
Graphs and Diagrams
MAXQDA also allows you to present your data in the form of graphs and diagrams. For example, you can create line graphs showing the distribution of codes over time or network diagrams showing the relationship of different themes with each other. Such visualizations help you reveal the relationships and trends between data more clearly. In addition, these graphs are effective tools to support your findings in your reports or presentations.
As a result, these visualization tools offered by MAXQDA contribute to presenting the findings obtained in qualitative data analysis in a more understandable, effective and professional way. By using these tools effectively, you can better reflect the depth and scope of your research and make it easier for your readers to understand your data.
Thematic Analysis Methods with MAXQDA
Thematic analysis used in qualitative research offers different methodological approaches to extract meaningful patterns from data. MAXQDA provides powerful tools that facilitate the application of these methods. Below, two most used methods in the literature, Braun and Clarke's (2006) thematic analysis approach and Attride-Stirling's (2001) thematic network method will be discussed in detail.
1. Braun and Clarke's (2006) Thematic Analysis Method
Braun and Clarke's (2006) thematic analysis method is one of the most cited and widely used approaches in the literature. In thematic analyses done with MAXQDA, this method offers researchers a systematic framework of six steps. Thanks to its flexible structure, it is frequently preferred especially in the fields of psychology, education and social sciences.
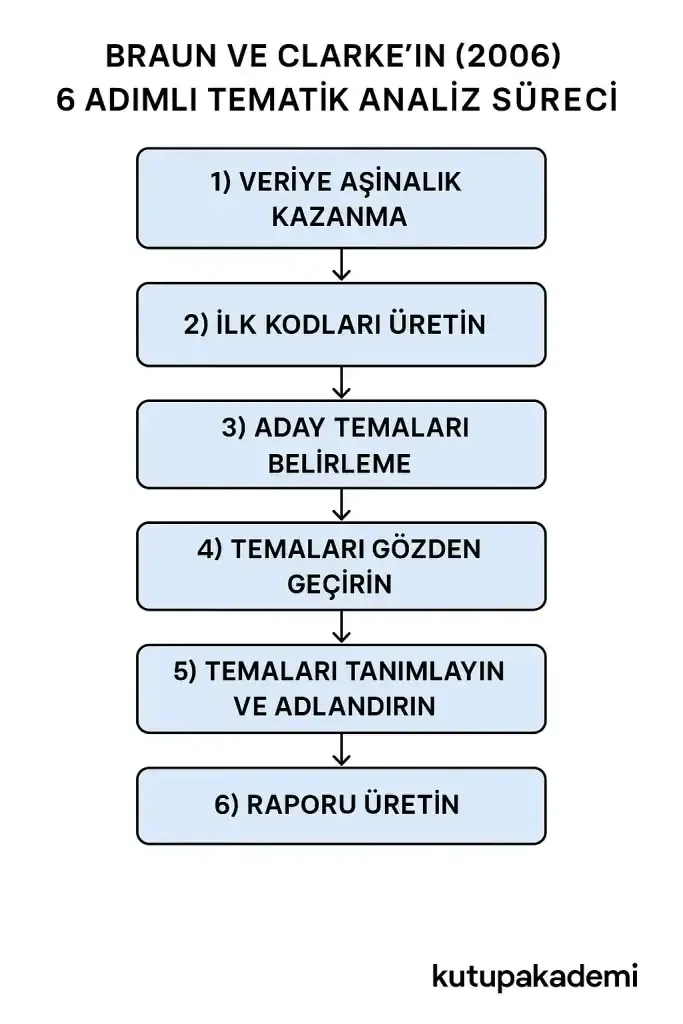
Below, Braun and Clarke's 6-step thematic analysis process is explained in detail how it is applied on MAXQDA:
1) Familiarizing Yourself with the Data
-
Transfer all text, audio and video data to MAXQDA. If necessary, transcribe audio/video recordings.
-
Read or watch the documents from beginning to end; record your first impressions as document memos.
-
Summarize paragraphs with the Paraphrase tool and mark important quotes.
-
Don't force themes at this stage; first get to know the data and understand the context.
2) Generating Initial Codes (Open Coding)
-
Select meaningful parts in the text and label them with in-vivo coding or short descriptive codes.
-
Organize codes hierarchically under Code System; add descriptions and examples to each code.
-
Use the Auto Code (Search & Autocode) function in large data sets; be sure to check the results.
-
If there are multiple coders, do an intercoder agreement test on a small subset to clarify coding rules.
3) Searching for Themes
-
Create candidate themes by grouping similar codes.
-
Visualize code clusters through MAXMaps and conceptualize relationships.
-
Examine how themes are distributed among participants/documents with Code Matrix Browser or Summary Grid.
4) Reviewing Themes
-
Level-1 (quote level): Are the quotes linked to each theme consistent? If necessary, split the theme, merge or reassign codes.
-
Level-2 (entire data set): Do themes cover the whole data set, do they answer research questions?
-
Examine the relationships and overlaps between themes using Code Relations Browser; remove unnecessary or orphaned codes.
5) Defining and Naming Themes
-
Write a core definition for each theme: core idea, sub-dimensions, scope and boundaries.
-
Choose short, memorable and descriptive theme names; support them with data quotes.
-
Select 2-3 strong example quotes for each theme; label with participant information.
-
Update your codebook to ensure consistency in reporting.
6) Producing the Report (Analytical Narrative + Evidence)
-
Return to your research questions and explain each theme relating to the theoretical framework.
-
Support themes with MAXMaps thematic maps and summary tables (theme definition, sub-themes, quotes).
-
Provide transparency in the method section: data types, sample, coding process, reliability and researcher reflection.
-
In the findings section, clearly convey the theoretical and practical contributions of themes; include transferability and future research suggestions.
2. Attride-Stirling's (2001) Thematic Network Method
Attride-Stirling's thematic network method (thematic network analysis) makes the analysis process more systematic and understandable by visualizing the relationships between themes, not limiting the data to codes only in qualitative research. This method is especially preferred in thematic analysis with MAXQDA processes, because it gives the researcher the opportunity to organize data at hierarchical levels and create a schematic network structure.
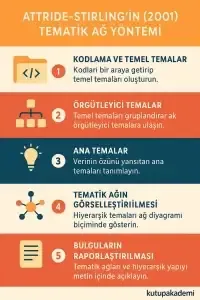
Attride-Stirling's approach consists of three basic layers: basic themes, organizing themes and global themes. These layers are explained step by step below:
1) Coding and Extraction of Basic Themes
-
Code meaningful expressions and quotes in the data.
-
Create basic themes by bringing codes together.
-
These themes are the smallest meaningful units that come directly from the data.
-
Example: "students' lack of motivation" or "inadequacy of teacher support".
2) Determining Organizing Themes
-
Group similar or related basic themes.
-
These groups create organizing themes that offer higher level explanations.
-
Organizing themes reveal main patterns in the data.
-
Example: "obstacles in the education process" or "social support sources".
3) Defining Global Themes
-
Extract global themes by bringing together multiple organizing themes.
-
Global themes are the highest level concepts that respond to the essence of research questions.
-
They represent the general findings at the center of the study.
-
Example: "factors affecting learning motivation".
4) Visualizing the Thematic Network
-
With MAXQDA's MAXMaps or similar visualization tools, show basic–organizing–global themes hierarchically.
-
Create a network diagram with the global theme in the middle, organizing themes around it and basic themes on the outside.
-
This network presents the relationships in the data in a clear and visual way.
5) Analysis and Interpretation of the Thematic Network
-
Examine the related organizing and basic themes for each global theme.
-
Discuss how themes respond to research questions.
-
Support the connections in the thematic network with strong example quotes.
6) Reporting the Findings
-
Explain the thematic networks in the text and support with visual diagrams.
-
Report the findings hierarchically starting from basic themes first to organizing themes and finally to global themes.
-
Thanks to this structure, the reader can easily follow the logical flow of the research.
What Should You Pay Attention to When Performing Thematic Analysis with MAXQDA?
Data Privacy and Ethical Rules: It is important that research data is anonymized and stored in accordance with ethical rules.
Correct Coding and Theme Determination: Make the analysis process reliable by establishing logical connections between codes, themes and sub-themes.
Creating a Coding Structure Appropriate to Research Questions: The coding process should proceed in a way that directly answers the basic research questions of your study.
MAXQDA Thematic Analysis Service Prices and Packages
Qualitative data analysis services pricing varies according to:
- The size of the data set,
- Coding and theme extraction process,
- Reporting format.
Contact us for information about the most affordable qualitative data analysis services!
Frequently Asked Questions (FAQ)
How to perform thematic analysis with MAXQDA?
In MAXQDA, the data set is imported, coding is done, then themes are determined and analysis results are reported.
How long does thematic analysis take using MAXQDA?
Depending on the size of the data, it can take several days.
Which qualitative analysis methods can be applied with MAXQDA?
Thematic analysis, content analysis, discourse analysis and narrative analysis can be applied with MAXQDA.
Conclusion: Strengthen Your Research by Performing Thematic Analysis with MAXQDA
MAXQDA offers powerful tools for qualitative data analysis and thematic analysis. Having thematic analysis done with MAXQDA helps you process your data more systematically and increase the reliability of your academic studies.
If you also want to have a professional thematic analysis done or receive qualitative data analysis support, contact us immediately! If you want to see a professional thematic analysis example, be sure to contact us!